Apply filters
In Step 2, you can filter and review your project’s data before analysis. These tools can be useful if you’re interested in analyzing only a subset of the data. For example, you may want to analyze outcomes only for mammals or only within one month of time.
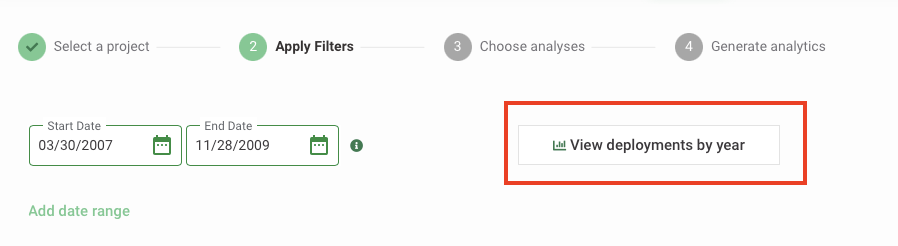
View deployments by year
Wildlife Insights provides an easy way to view deployments across time. Click on the View deployments by year button at the top right of the screen to visualize all deployments within the selected project. The y-axis will show the Location name, and the x-axis will show the year.
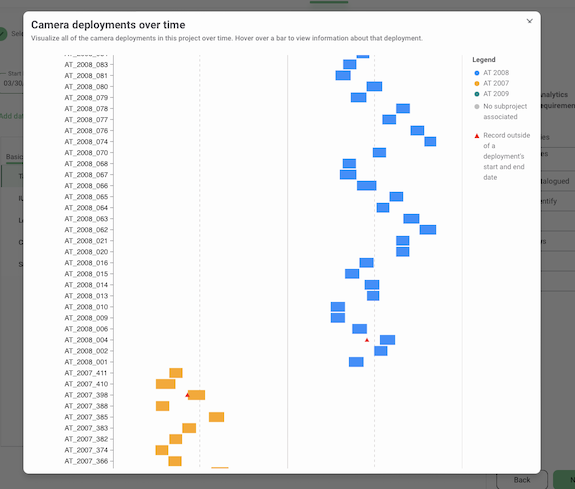
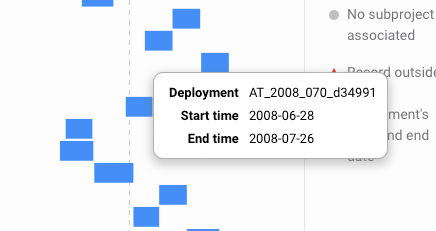
Each bar in the graph represents a deployment and will be colored by subproject. If no subprojects are assigned in your project, each deployment bar will be grey. Hover over a bar to view the deployment name, the deployment start date and end date.
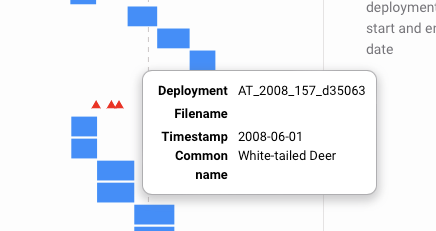
This graph can be useful for running quality checks on your dataset and ensuring no images with a timestamp lie outside of a deployment start or end date. If an image with a timestamp outside of the deployment, a red triangle will appear next to the deployment. You can use tools in Wildlife Insights to correct the timestamp.
Hover over the triangle to view the filename, timestamp of the image, the identification (common name) and the deployment name. You can use this information to return to the project’s Catalogued tab and edit the image timestamp.
Select a date range
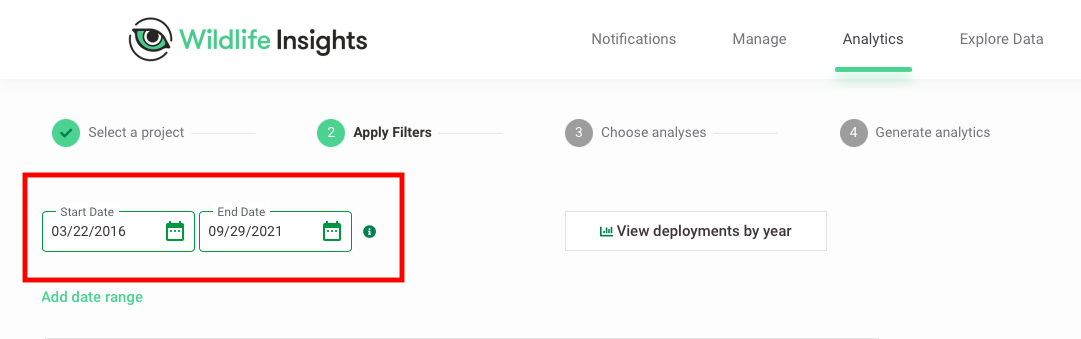
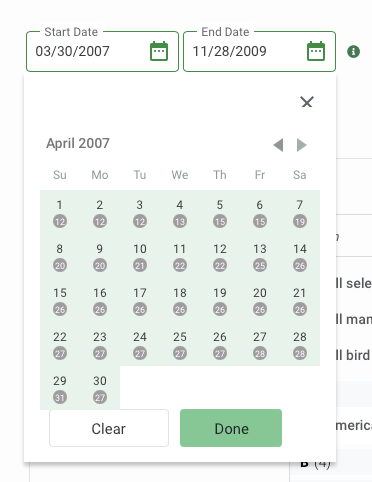
By default, the date range selected includes the first date a camera was deployed and the last date a camera was deployed in your project. Select a custom date range by clicking within the Start Date and End Date fields at the top of the page. Here, you can select the start and end dates desired and click Done when your selection is complete.
Below each date, Wildlife Insights displays the number of camera deployments active on that day.
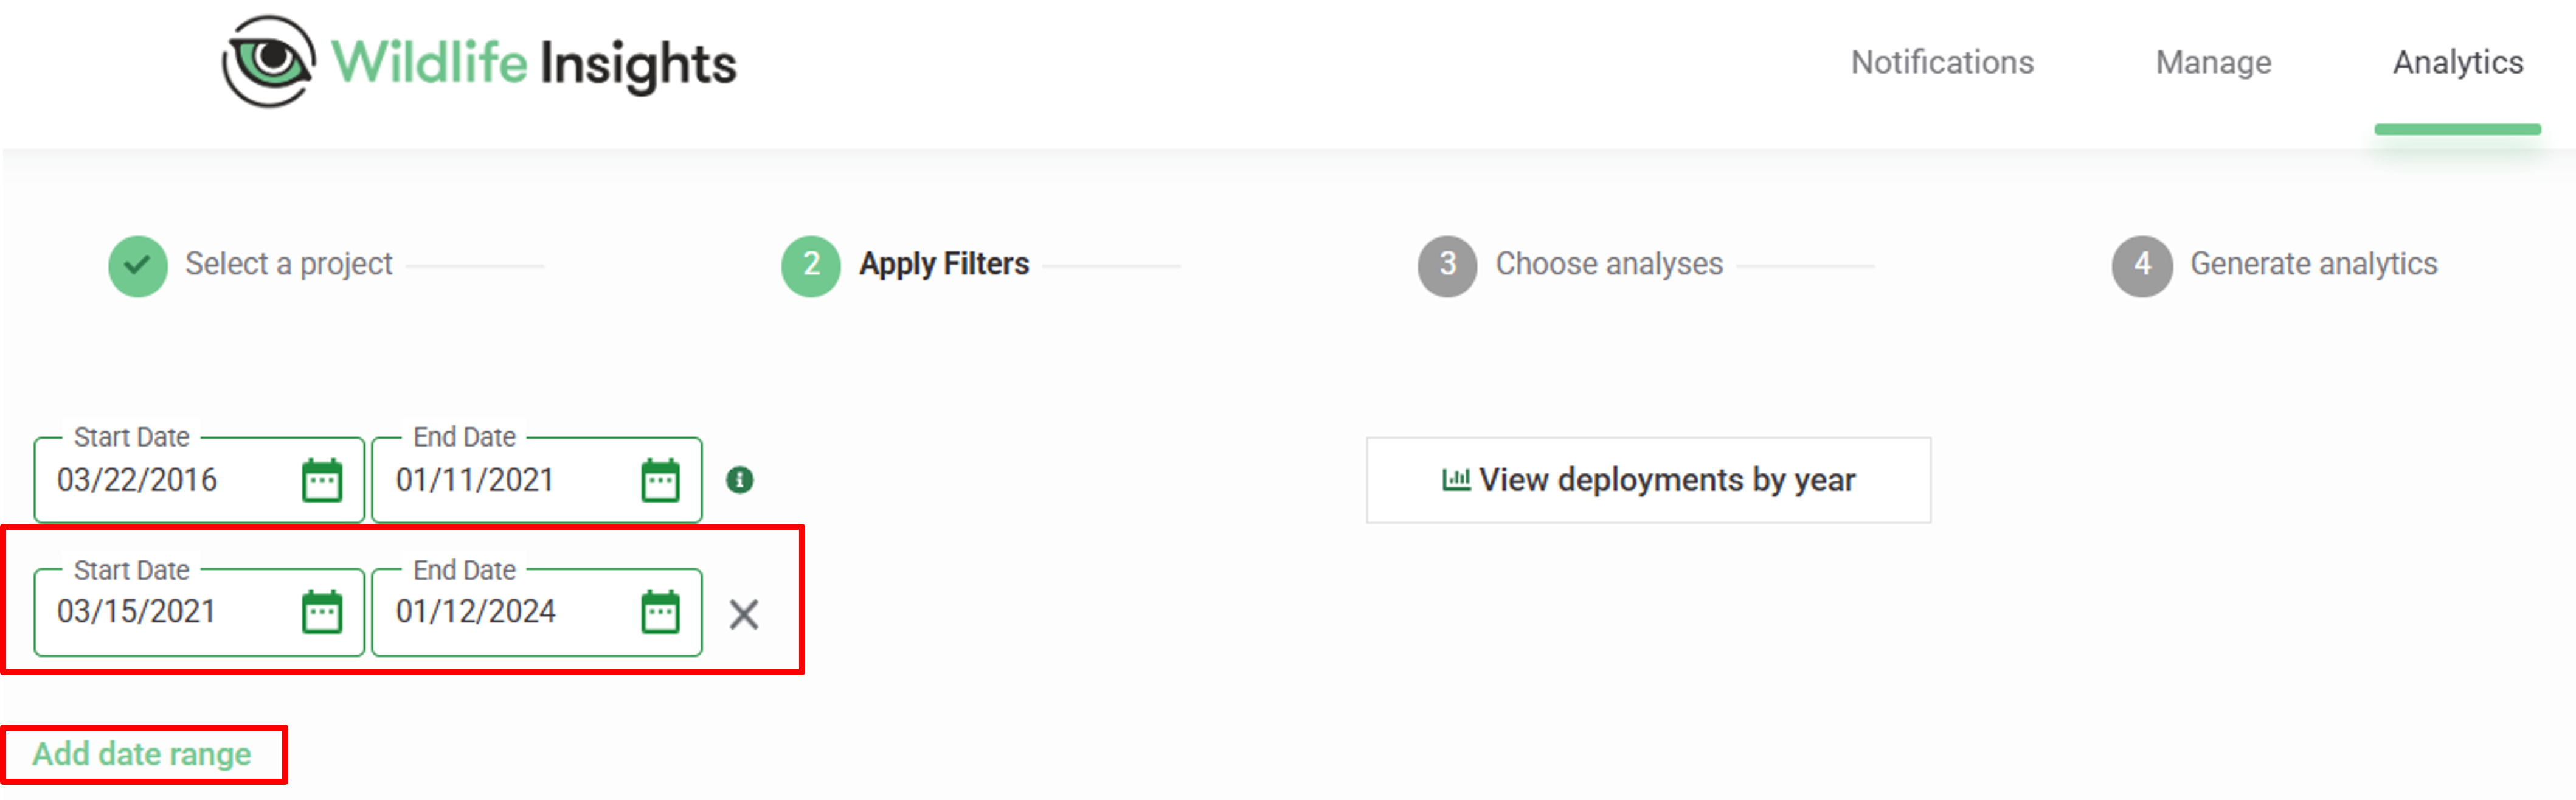
Add multiple date ranges
Using the Add date range button will allow you to add more than one date range, giving you more control over what data is included.
The multiple date range selection can be useful for
- Comparing outcomes during the rainy season of your projects. In this case, you would select the months for this season for all the years you have data.
- Comparing pre- and post-intervention outcomes. You can select a date range before and after the intervention was applied.
Select other filters
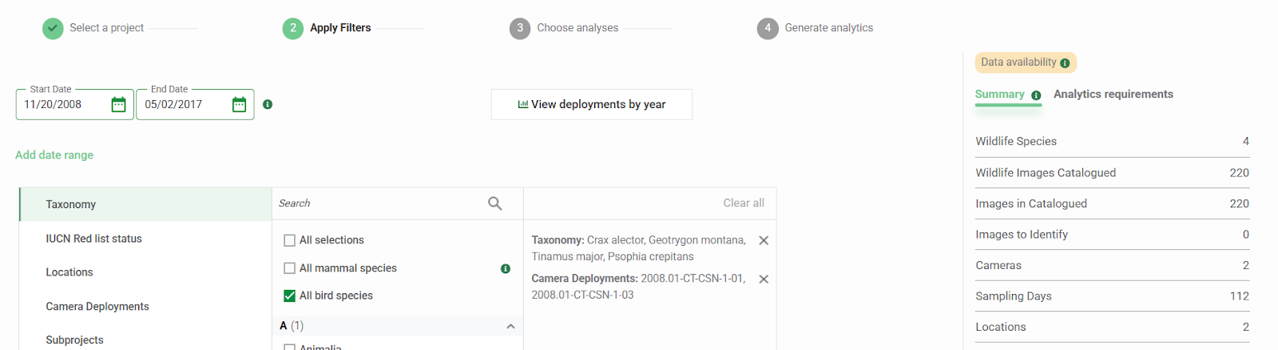
Below the date range selection are filters you can apply to subset your project data.
Click any category to view filter options in the middle column. By default, All Selections within all categories are included. Note that the default All selections option will not display any results in the right-hand column unless you click All selections again.
Select from the following categories in the left-hand column:
- Taxonomy: You have the option of choosing All selections, All mammal species, All bird species, or select a custom set of ID tags. The options to select All mammal species and All bird species will select all mammal or bird identifications tagged at the species level. It does not select higher taxon levels that fall within the Mammal or Bird Class (e.g., Canine Family).
- IUCN Red List Status: Select species according to their IUCN Red List classification.
- Locations: Select by project locations (i.e., the name associated with the Latitude and Longitude of a site).
- Camera Deployments: Select by camera deployments.
- Subprojects: Select by subproject
- Camera status: Select by the status of the camera at the deployment (e.g., Camera functioning)
- Camera height: Select by the height of the camera when set (e.g., Knee height)
- Camera angle: Select by the angle the camera was set (e.g., Parallel)
- Cameras: Select by name of the camera (i.e., the device)
- Feature types: Select by feature types (e.g., Game trails) associated with the deployment.
- Bait type: Select by type of bait set at the deployment (e.g., Scent).
As you select the filter options in the middle column, two things will happen:
- The selections will appear in the right-hand column. You can reset the filters by clicking Clear all or the X button to remove a specific category selection.
- The Summary on the right side of the page will update with each filter selection, depending on the data you have selected. You will also see a list of the top species by image count below the summary.
Apply your filters
Once you are done selecting filters, click on the green Next button.
If you wish to change the selected project, click Back to return to the previous step.
Continue to Step 3 - Choose analyses.
 Back to the guide